|
ipMonitor 6.1 Change Report | ||
| < Back | Index | Next > |
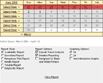 The Change Report dialog allows for immediate customization of the current report. The dialog's main feature is a calendar which permits the selection of a specific day, week, or month.
To navigate the calendar, click the previous or next month until the period you wish to view is displayed. Click the day of month, the month name (top left corner), or the week (on the left) to select the period. Once a time period is selected, it will be highlighted in red. Additionally, the time period will be listed underneath the calendar in gray text. Other available customization options: Report Style - Select the kind of data to report:
Include historical trend analysis:
Detailed reporting: Designed for black and white printers: This option will assign grayscales to all of the colored elements in the Report, making the report easy to display.
Graphing Options - specify the graph style:
Once you have selected which statistics and how they will be displayed, click View Report.
|
||